Statistiken
Die Seite Statistiken verwandelt Ihre erfassten Aufgaben in Diagramme. Sie können sehen, wie sich Ihre Zeit und Ihre Einnahmen nach Tagen, Projekten und Tags über einen von Ihnen gewählten Zeitraum aufschlüsseln.
Zeitraum und Filter
Oben auf der Seite legen Sie fest, welche Daten die Diagramme verwenden.
- Zeitraum (oberstes Feld): der Zeitraum, den die Diagramme abdecken.
- Vergleichszeitraum (zweites Feld): ein früherer Zeitraum zum Vergleich. Die prozentuale Veränderung auf jeder Übersichtskarte vergleicht den aktuellen Zeitraum mit diesem.
Verwenden Sie die Filterzeile, um die Daten weiter einzugrenzen:
- Suche: Finden Sie Aufgaben per Text.
- Status- und Typ-Dropdowns: Grenzen Sie die Ergebnisse nach Aufgabenstatus oder Aufgabentyp ein.
- Projekt- und Tag-Dropdowns: Konzentrieren Sie sich auf bestimmte Projekte oder Tags.
- Teammitglied: Zeigen Sie Daten für ausgewählte Personen an.
- Stimmung: Filtern Sie nach der auf Aufgaben festgelegten Stimmung.
Die Schaltfläche Filter zeigt an, wie viele Filter aktiv sind. Verwenden Sie die Schaltfläche +/-, um den Vergleich ein- oder auszuschalten.
Übersichtskarten
Vier Karten befinden sich über den Diagrammen und summieren den ausgewählten Zeitraum. Jede Karte zeigt einen Wert und die prozentuale Veränderung gegenüber dem Vergleichszeitraum, wobei Grün eine Zunahme kennzeichnet.
- Dauer: insgesamt erfasste Zeit.
- Gesamt: Gesamteinnahmen.
- Auslagen: gesamte Auslagen.
- Pausen: gesamte Pausenzeit.
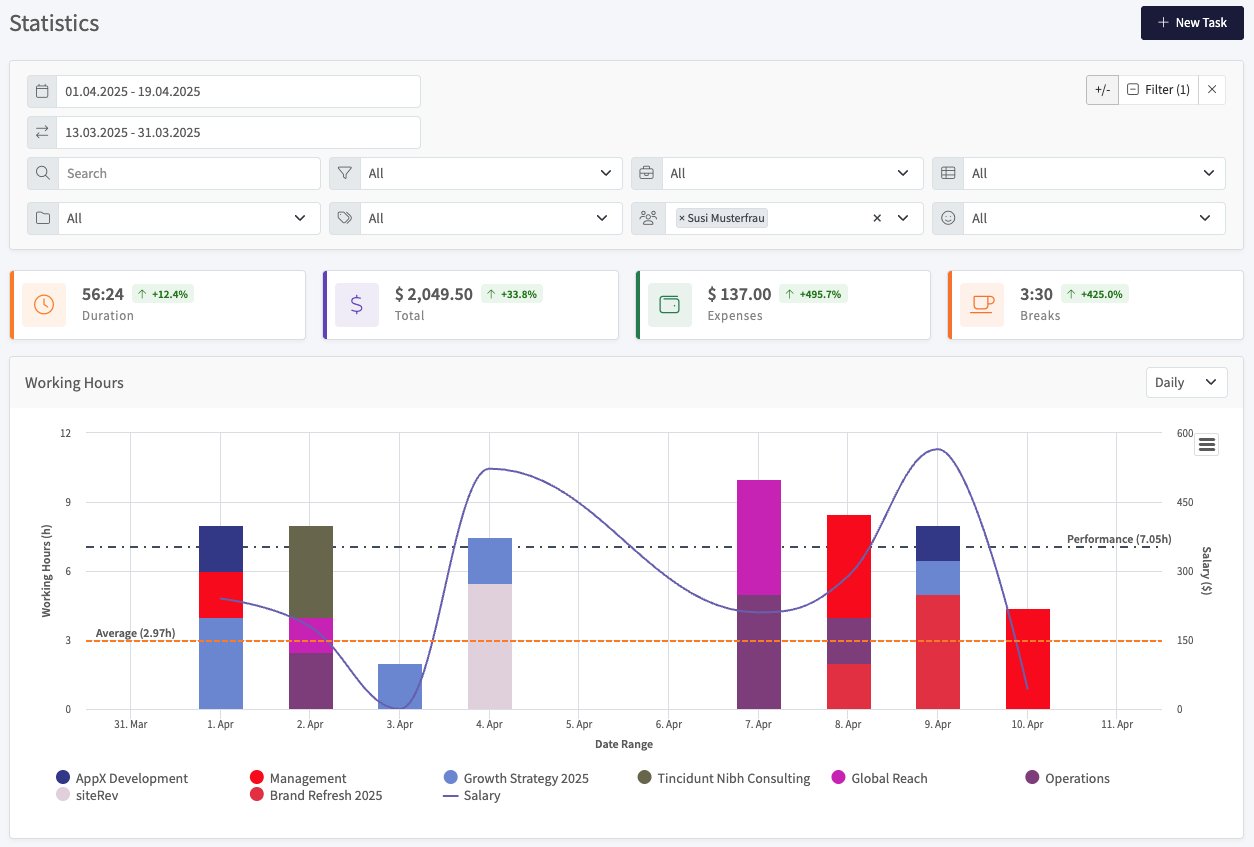
Arbeitsstunden
Das Diagramm Arbeitsstunden zeigt die erfasste Zeit pro Tag als gestapelte Balken, mit einer Farbe pro Projekt. So lesen Sie es:
- Linke Achse: Arbeitsstunden pro Tag.
- Rechte Achse: Einnahmen (Gehalt).
- Gestapelte Balken: Stunden pro Projekt an jedem Tag. Die Legende unter dem Diagramm ordnet jeder Farbe ein Projekt zu.
- Gehaltslinie: Einnahmen über den Zeitraum.
- Leistungslinie (gestrichelt, dunkel): Ihr täglicher Arbeitsstundenwert.
- Durchschnittslinie (gestrichelt, orange): der Durchschnitt über den Zeitraum.
Verwenden Sie das Dropdown-Menü oben rechts im Diagramm, um die Gruppierung zu wechseln (zum Beispiel Täglich).
Dauer und Gehälter nach Projekt
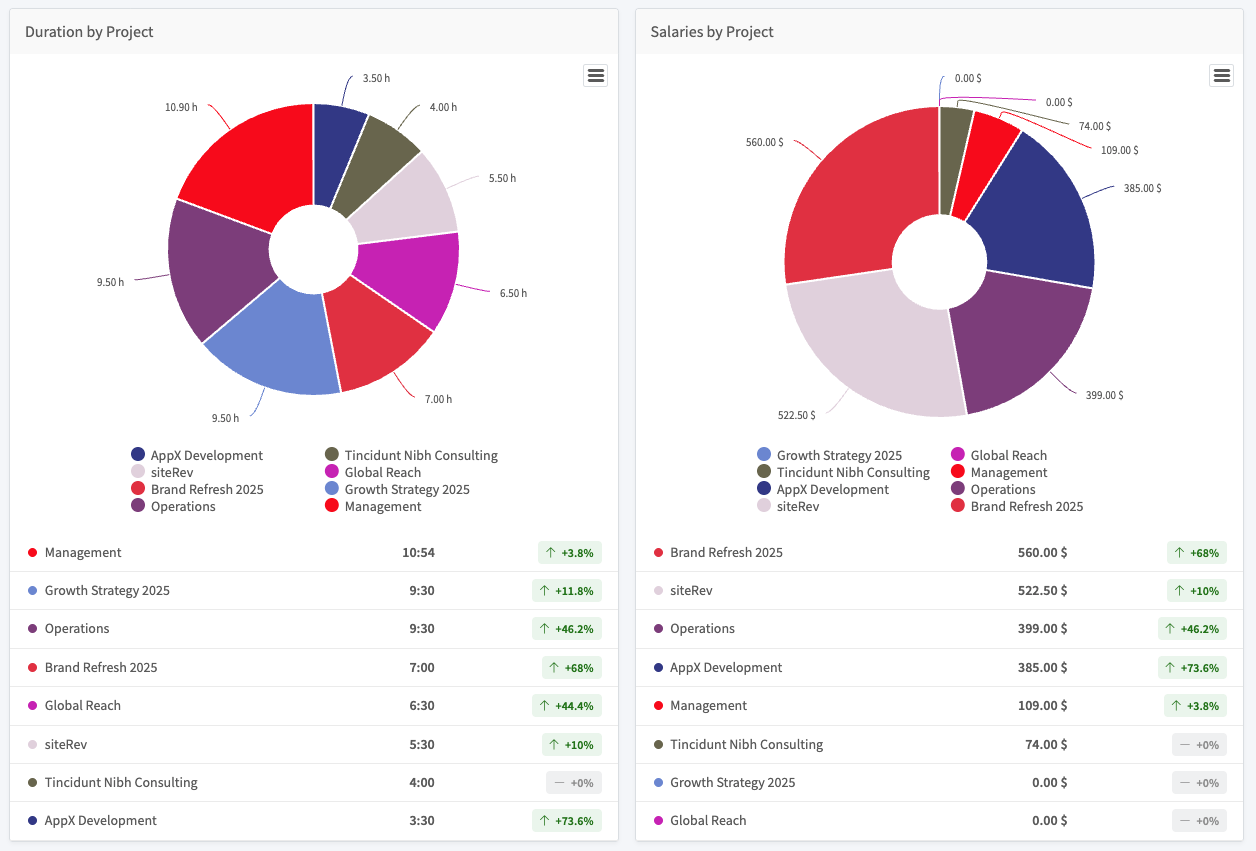
Zwei Ringdiagramme vergleichen Ihre Projekte nebeneinander:
- Dauer nach Projekt: wie sich Ihre erfasste Zeit auf die Projekte verteilt.
- Gehälter nach Projekt: wie sich Ihre Einnahmen auf die Projekte verteilen.
Unter jedem Diagramm befindet sich eine Rangliste. Jede Zeile zeigt den Projektnamen, seinen Wert (Stunden oder Betrag) und die prozentuale Veränderung gegenüber dem Vergleichszeitraum.
Dauer nach Tag
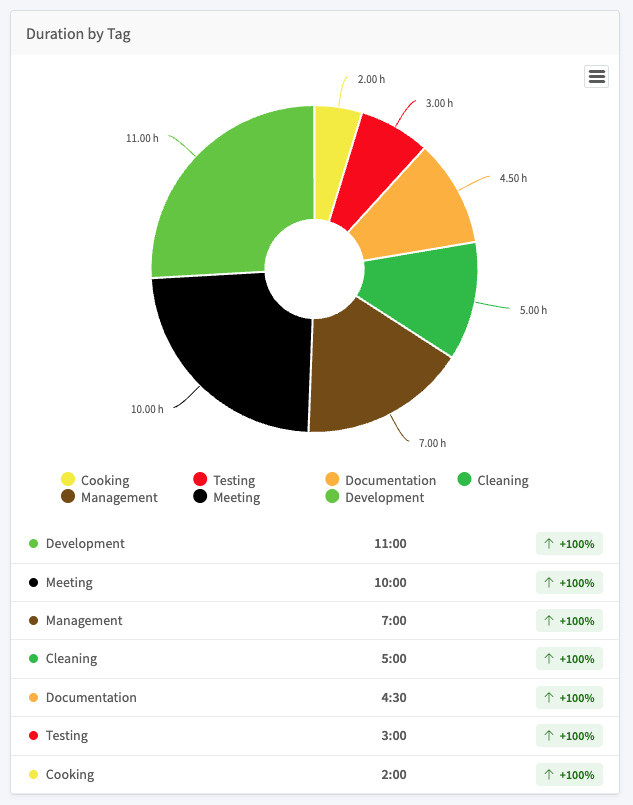
Das Ringdiagramm Dauer nach Tag teilt Ihre erfasste Zeit nach Tag auf. Die Rangliste darunter zeigt jeden Tag, seine Gesamtzeit und die prozentuale Veränderung gegenüber dem Vergleichszeitraum.
Kilometerstand und Standorte

Der Bereich Kilometerstand summiert die zurückgelegte Entfernung für den ausgewählten Zeitraum.
- Kilometerstand: Gesamtentfernung aus Ihren Aufgaben.
- Standorte: Wählen Sie Herunterladen, um Standortdaten zu exportieren.
Ein Diagramm exportieren
Jedes Diagramm verfügt oben rechts über eine Menüschaltfläche. Öffnen Sie sie, um das Diagramm als Bild (PNG oder JPEG), als PDF oder als Vektordatei (SVG) zu exportieren.