Dashboard
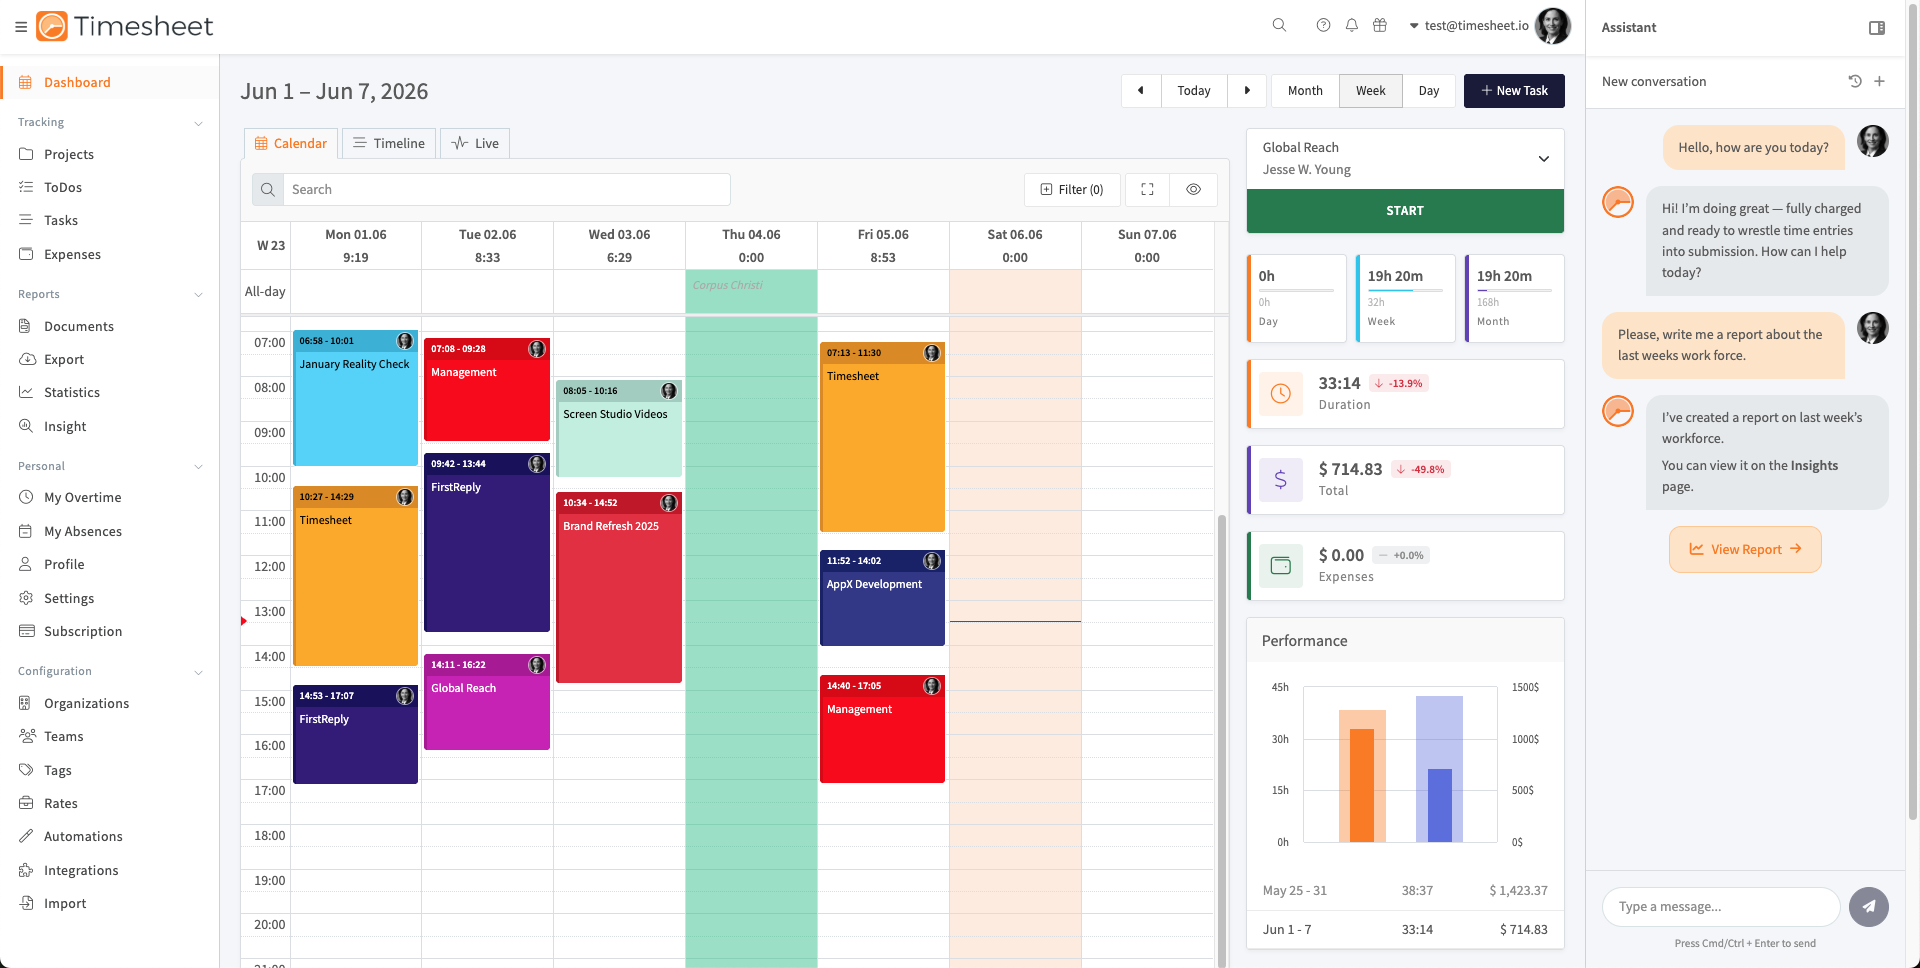
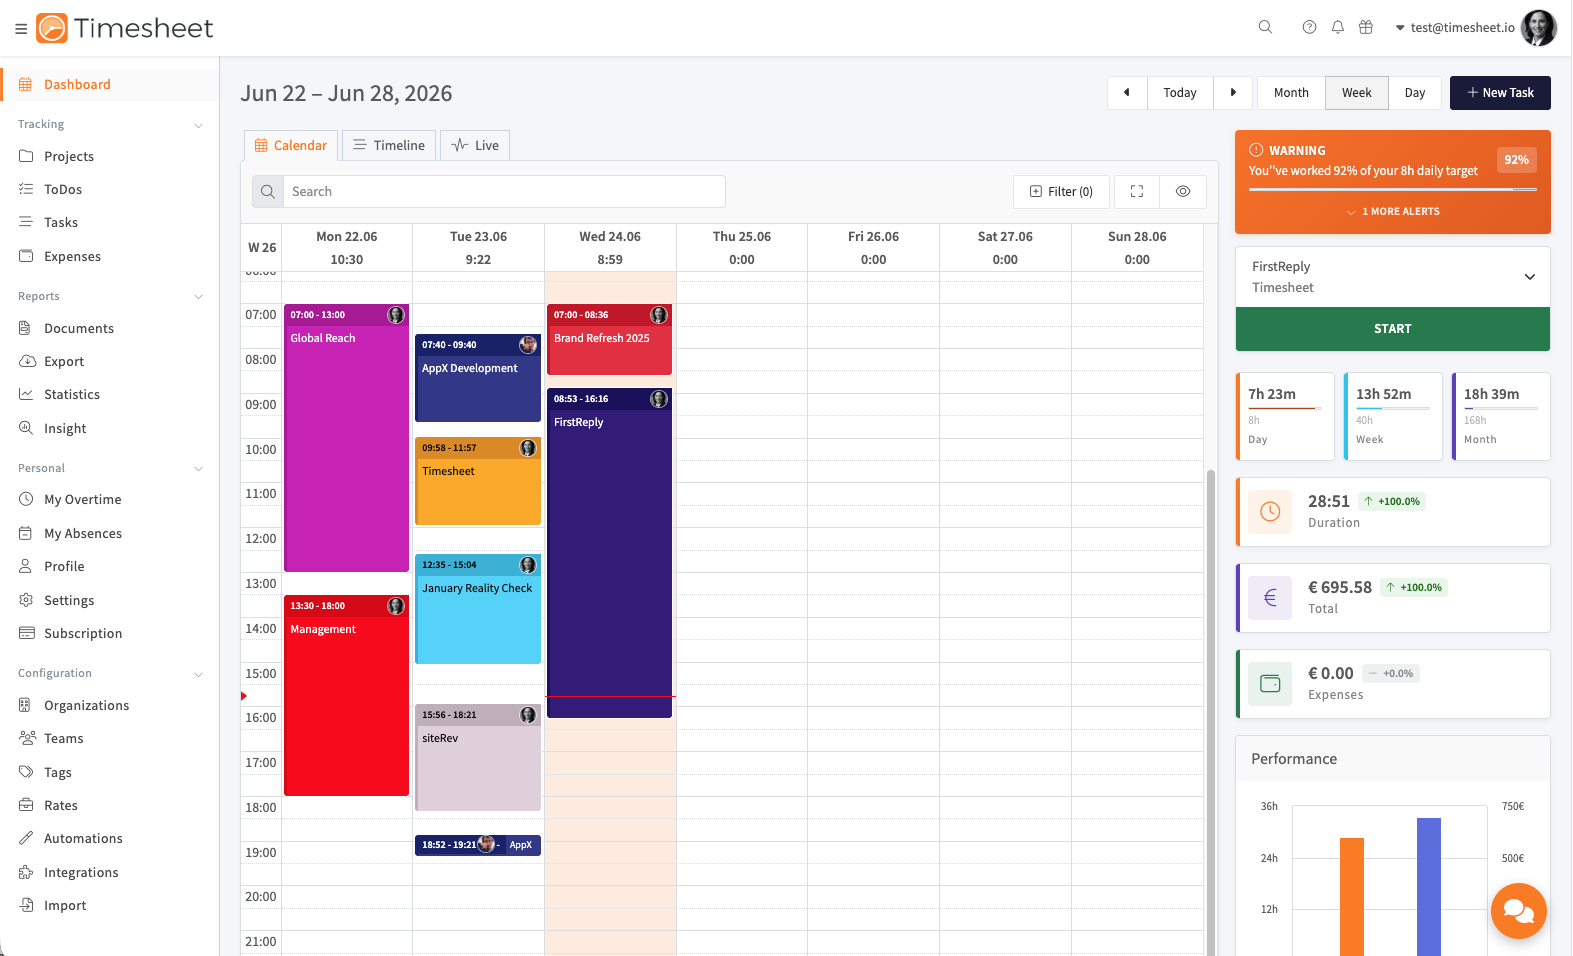
The Dashboard is your main workspace in the Timesheet web application. It shows your time entries in different views and provides quick access to start and stop the timer.
Dashboard layout
The Dashboard has four main areas:
Left navigation
- Access all sections of the application (Projects, Tasks, Statistics, and more)
- Can be collapsed to give more space to the main area
Top bar
- Date navigation (previous and next week, jump to today)
- View selection: Calendar, Timeline, and Live
- + New Task button to create manual entries
- Filter button to show only specific data
Main area
- Displays your time entries in the selected view
- Changes depending on whether you choose Calendar, Timeline, or Live view
Right sidebar
- Project selector dropdown
- START button to begin tracking time
- Quick statistics showing duration, earnings, and expenses
- Performance chart comparing the current and previous period
- The HR widget (Business plan), showing your hours against your contract target
Calendar view
The Calendar view shows your time entries as colored blocks on a weekly schedule, similar to a regular calendar.
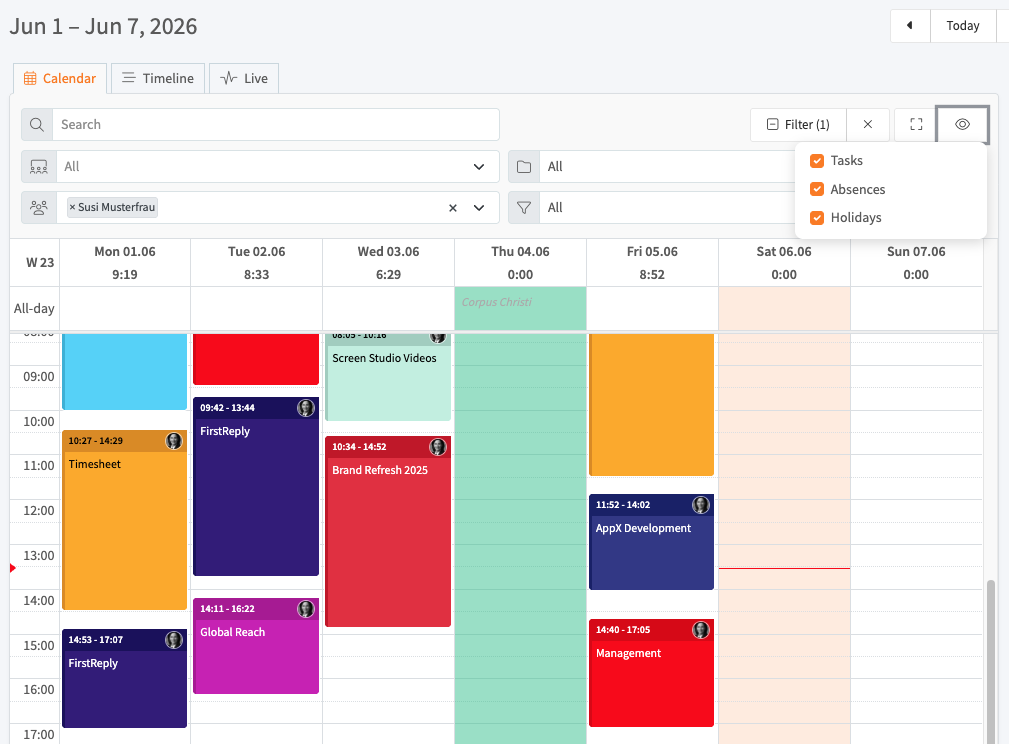
What you see:
- One column for each day of the week
- Time blocks positioned at the time they started
- Each block shows the project name, time range, and description
- A different color for each project
- Daily totals at the top of each column
How to use it:
- Click the ← → arrows to navigate between weeks
- Click Today to jump to the current week
- Switch between Month, Week, and Day views
- Click a time block to edit that task
- Click an empty time slot to create a new task
- Use the Search bar to find specific tasks
- Click Filter to show only certain projects or team members
Timeline view
The Timeline view groups time entries by project and shows which team members worked on each one during the day.
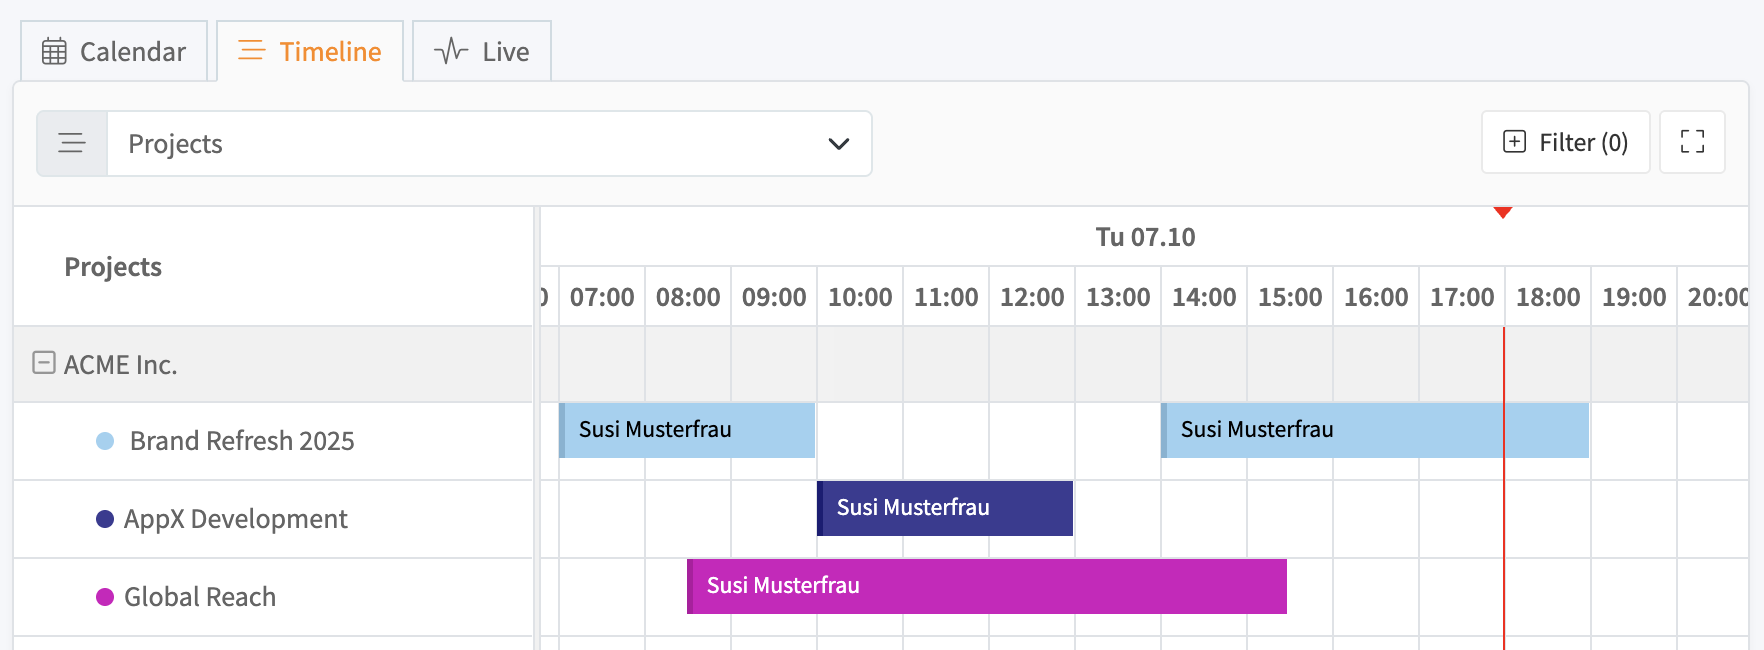
What you see:
- Projects listed on the left
- Team members shown under each project
- A horizontal timeline across the hours of the day
- Time blocks showing when each person worked
- The same project colors as the Calendar view
How to use it:
- Click the ← → arrows to navigate between days
- Click Today to jump to the current day
- Select specific projects from the Projects dropdown on the left
- Click the fullscreen icon for a larger view
- Hover over a time block to see task details
Live view
The Live view shows which team members are currently working and where they are located. Switch between List and Map views using the toggle buttons in the top right corner.
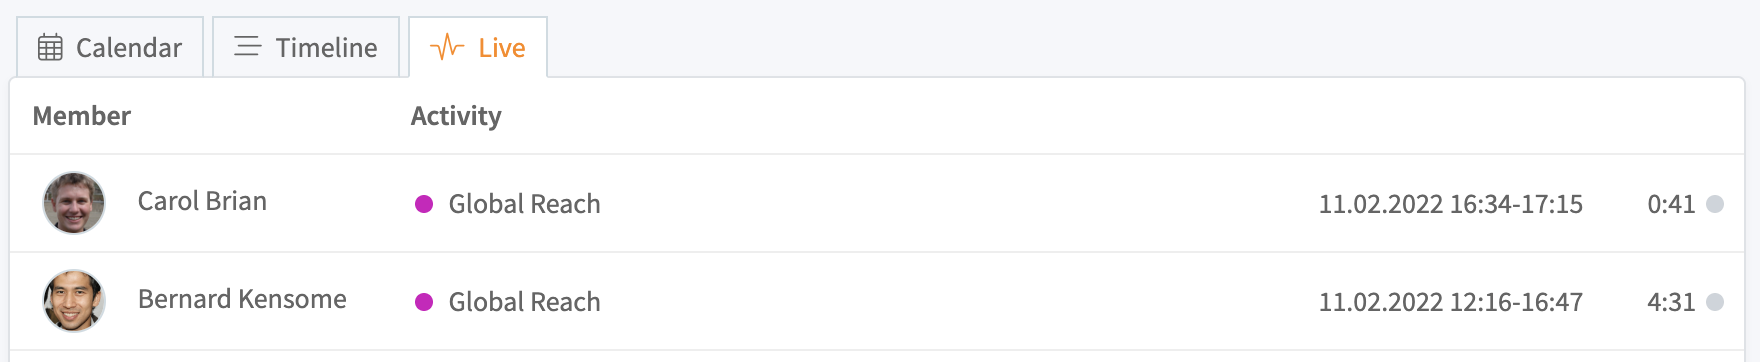
List view
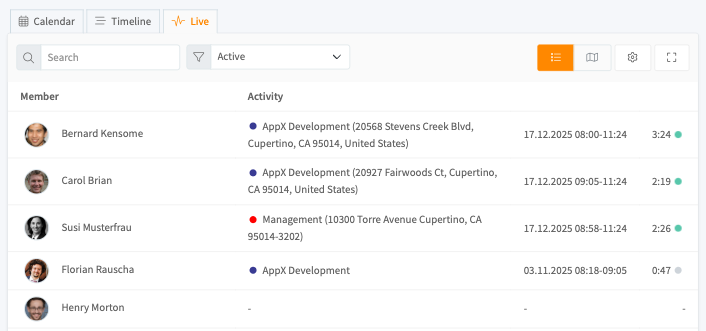
The list view displays team activity in a table:
- Member: profile photo and name
- Activity: project name (color-coded) and work location address
- Date/Time: when the work session started
- Duration: elapsed time, with a green indicator for running timers
Use the Search bar to find specific team members and the Active filter to show only members currently working.
Map view
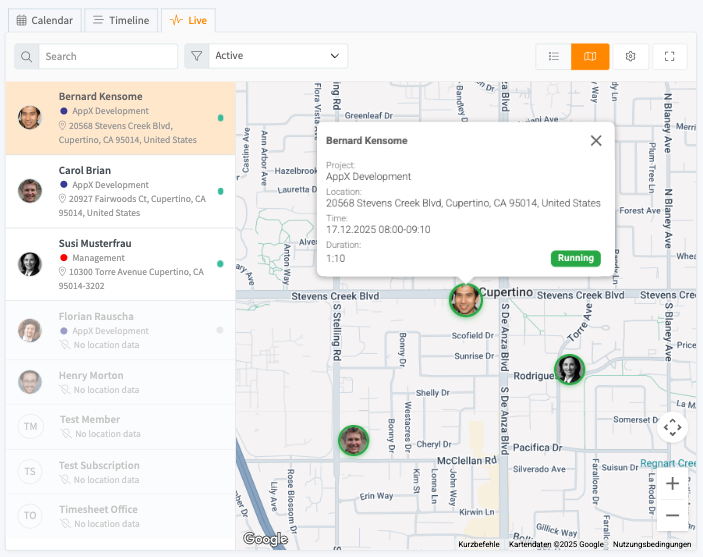
The map view shows team member locations on an interactive map:
- Team members appear as profile photo markers on the map
- The sidebar lists all members with their project and location
- Members without location data show "No location data"
Click a team member in the sidebar to:
- Center the map on their location
- Open a popup with their current work details (project, location, time, duration)
- See their "Running" status if they are actively tracking time
The view updates automatically when team members start or stop their timers, so you can see where your team is working at any time.
Integrated timer
The timer is always visible on the right side of the Dashboard, in every view.


Starting the timer:
- Select a project from the Operations dropdown
- Click the green START button
- The timer begins counting and the button changes to STOP
While the timer is running:
- The elapsed time updates every second
- Your task appears in the Calendar view at the current time
- The statistics below the timer update automatically
Stopping the timer:
- Click the red STOP button
- Review the task details in the dialog that opens
- Add or edit the description, tags, and other information
- Click Save
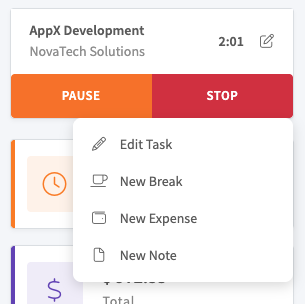
Timer actions:
- Click the ⋮ (three dots) menu while the timer is running to add notes or expenses
Quick statistics
The Dashboard shows three statistics cards below the timer that summarize the selected period.
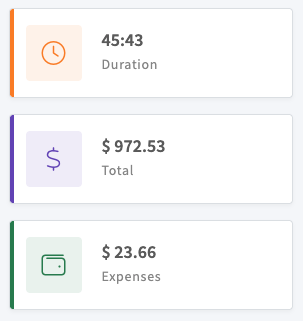
Duration (orange card)
- Total time you have tracked, shown in hours and minutes
Total (purple card)
- Total earnings calculated from your hourly rates for each project
- Updates automatically when you add or stop tasks
Expenses (green card)
- Total expenses you have logged for the selected period
The statistics change based on the date range you select in the Calendar view. If you navigate to a different week, the statistics update to show data for that week.
HR widget
On a Business plan with an active contract, an extra set of cards appears in the right sidebar, below the timer. The HR widget shows your worked hours against the target set by your contract.

There are three cards: Day, Week, and Month. Each card shows:
- The hours you have worked in that period (the large number)
- A progress bar filling toward your target
- The target for that period (the smaller number below the bar)
The progress bar changes color as you approach the target: the default color while you have time remaining, amber as you get close, and red once you go over. While a timer is running, the cards update automatically.
Working time alerts
On a Business plan, the right sidebar also shows live working time alerts above the timer. They warn you as you approach your daily target and remind you about required breaks, so you can stay within your contract and local labor rules while you work.
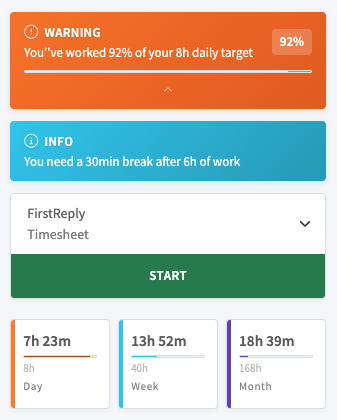
- A warning appears as you near or pass your daily target, for example "You've worked 92% of your 8h daily target".
- An info note reminds you about breaks, for example "You need a 30min break after 6h of work".
- Select More alerts to expand the full list.
The alerts appear next to your calendar as you work, so a problem is visible the moment it happens.
These alerts use the rules from your contract and employment model. Managers can review formal violations on the Compliance page.
Performance chart
Below the statistics cards, a chart compares your current performance with the previous period.
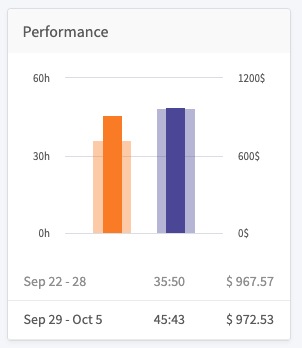
It shows whether you are working more or less than in previous weeks.
Filters
Click the Filter button at the top to show only specific data.
Available filters:
- Projects: show only selected projects
- Team Members: show only specific people (for team managers)
- Status: filter by billable, billed, or paid tasks
- Tags: show tasks with specific tags
The number next to "Filter" shows how many filters are active. Click the X button to remove them.
Creating tasks manually
Besides using the timer, you can create tasks manually:
Option 1: Click on the calendar
- Click an empty time slot in the Calendar view
- Fill in the start time, end time, project, and description
- Click Save
Option 2: Use the New Task button
- Click + New Task in the top bar
- Fill in all task details
- Click Save
Manual tasks appear in the Calendar view just like tasks created with the timer.
Fullscreen mode
Click the fullscreen icon (⛶) in the top right corner to hide the left navigation and use the full width of your screen. This gives you more space for your calendar, especially when viewing multiple weeks or working with many projects.
Click the icon again to restore the normal view.