Getting Started with the Web Application
The Timesheet web app at my.timesheet.io is the desktop home of Timesheet. It uses the same data as the mobile apps, with more room to manage projects, run reports, send invoices, and work with your team.
This guide takes you from a new account to your first tracked hours, then points you to the larger features (AI, teams, HR) when you need them.
The mobile apps for Android and iOS are free. The web app requires a Pro plan or above. Teams, invoices, the API, and the Chronis AI assistant are included with Pro. The HR features (contracts, overtime, absences, compliance) require a Business plan. See the Plans page for the full comparison.
New here? Start a 30-day free trial at my.timesheet.io/signup. No credit card is required. The trial includes the full Pro experience.
Create your account
Go to my.timesheet.io/signup to create an account.
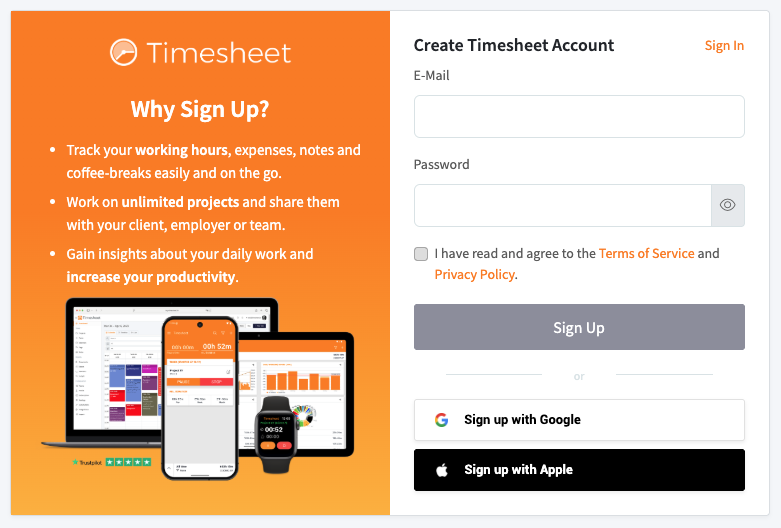
With an email and password:
- Enter your email address.
- Choose a password. Click the eye icon to show what you type.
- Tick the box to agree to the Terms of Service and Privacy Policy.
- Click Sign Up.
- Open the verification email and click the link inside.
Your 30-day trial starts once you verify, and you are taken to the Dashboard.
Social login: instead of a password, use Sign up with Google or Sign up with Apple. Apple Sign-In can keep your email address private.
Sign in with the same credentials you use on your phone. Your existing data appears in the web app automatically once you are on a plan with cloud sync (Plus and above).
Sign in
Once your account exists, my.timesheet.io opens the login screen.
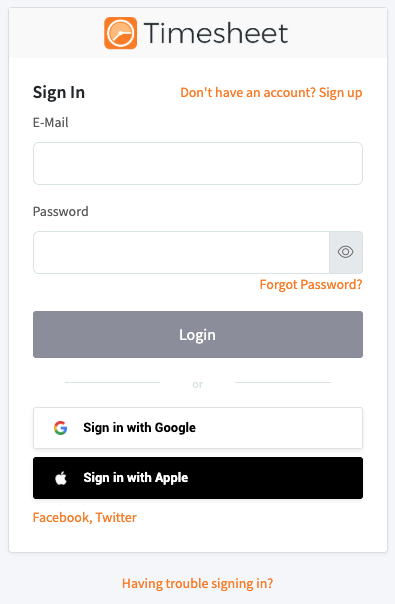
Enter your email and password and click Login, or use the same Google or Apple button you signed up with. Use the method you registered with: a Google login and an email login with the same address are two separate accounts.
Reset your password
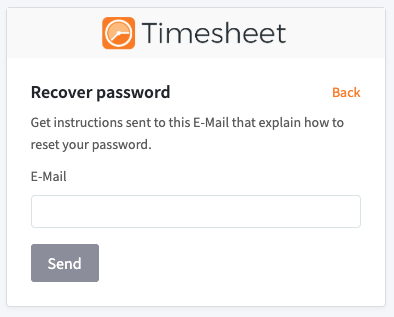
- Click Forgot Password? on the login screen.
- Enter your registered email address.
- Check your inbox (and spam folder) for the reset link.
- Follow the link and set a new password.
If you still cannot sign in, check the following:
- The email address is spelled correctly.
- Caps Lock is off.
- Your email is verified. An unverified account cannot sign in.
If the problem continues, email support@timesheet.io.
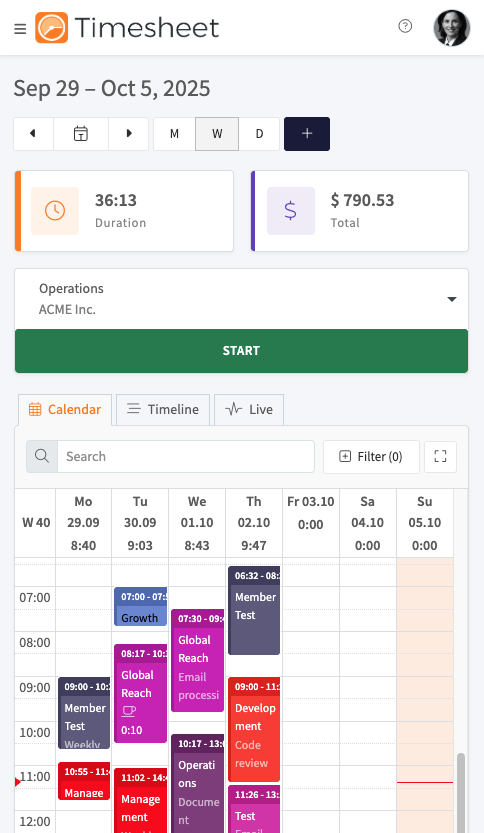
The Dashboard
After login you arrive at the Dashboard, your main workspace for time tracking.
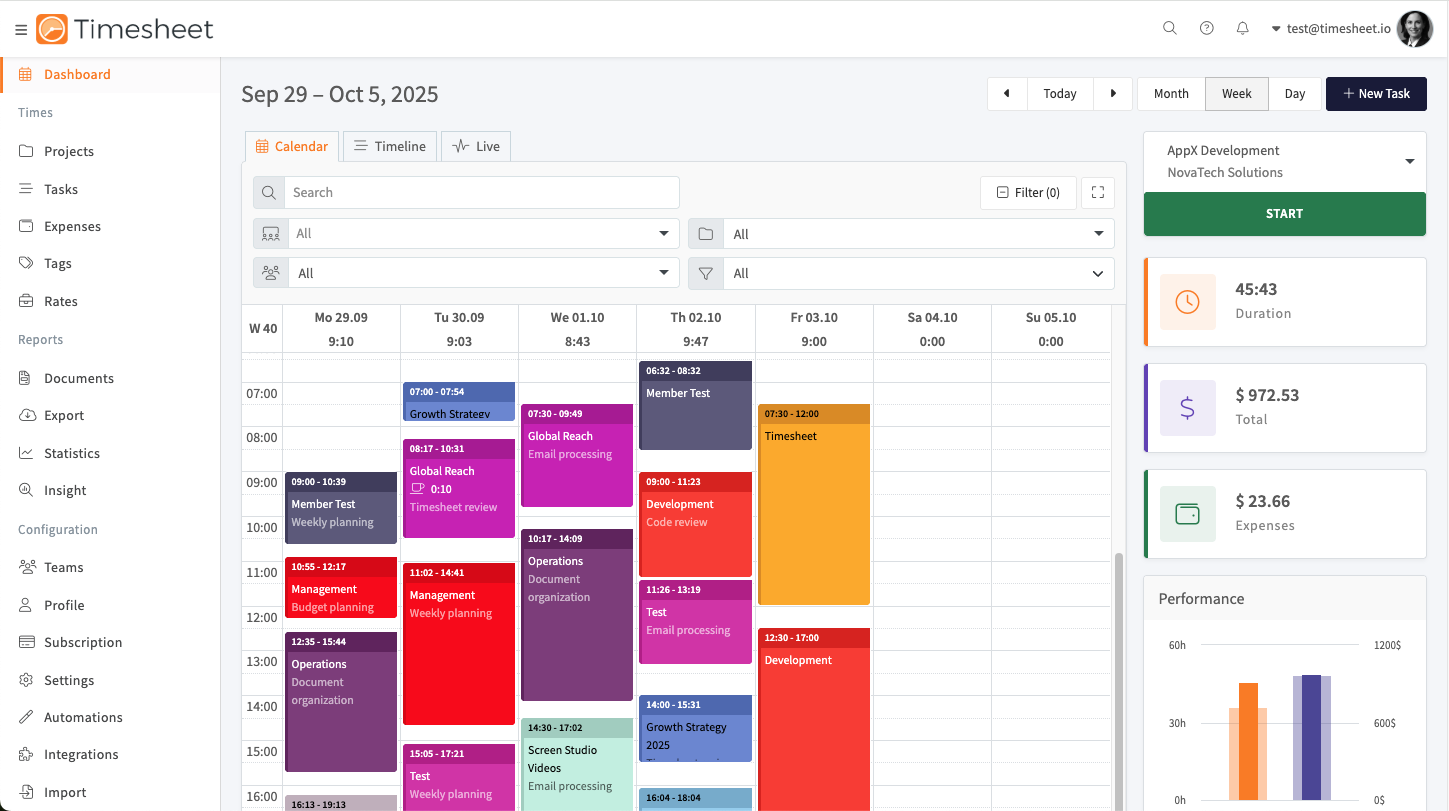
The screen has four areas:
- Left navigation: access to every section of the app.
- Top bar: date navigation, the Calendar, Timeline, and Live views, the + New Task button, and filters.
- Main area: your time entries in the selected view.
- Right sidebar: the timer, quick statistics, the performance chart, and the AI assistant.
See the Dashboard guide for the full details.
The navigation menu
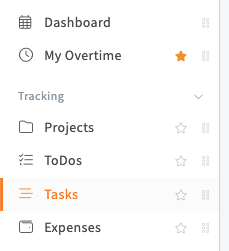
The Tracking group holds the day-to-day pages: Projects, ToDos, Tasks, and Expenses. Below it are reporting (Documents, Export, Statistics), your account (Profile, Settings, Subscription), and, on a Business plan, the HR pages (Organization, Contracts, Employment Models, Absences, Overtime, Compliance). Star the pages you use most to move them to the top.
Click the collapse icon to shrink the left panel to icons and give more space to your calendar.
On smaller screens
The web app is responsive and works on tablets and phone browsers. The navigation moves into a hamburger menu and the layout adjusts to the screen size. For regular phone use, the native apps are recommended.
The Chronis AI assistant
Chronis is the AI assistant in the right sidebar of the Dashboard. You can ask it questions in plain language instead of navigating the menus.
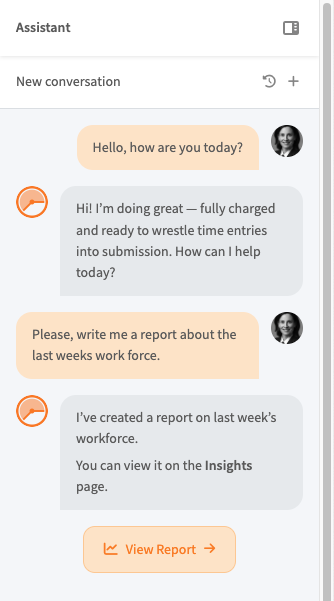
For example, ask it to write a report about last week's workforce and it generates the report, then gives you a button to open it. You can also ask for totals (such as this month's billable hours), check what your team is working on, and start or stop timers from the conversation. Reports it creates are saved on the Insights page.
Chronis also works in Telegram, Slack, Discord, WhatsApp, and Facebook Messenger, so you can log time from those apps. An MCP server connects the same assistant to Claude and ChatGPT.
Chronis is included with every plan that has web access (Pro, Business, and Enterprise), and it is available during your trial.
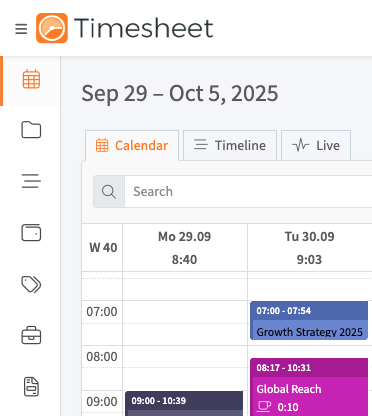
The three Dashboard views
The Dashboard shows the same week in three views. Switch between them with the tabs in the top bar.
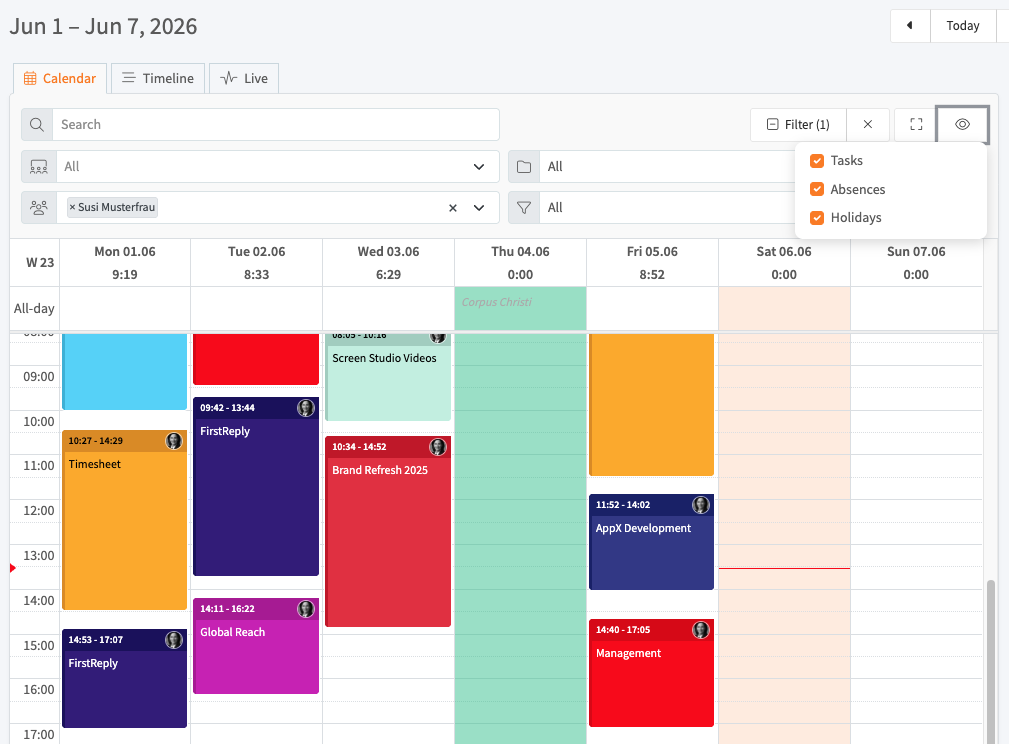
- Calendar: your entries as colored blocks on a weekly grid, at the times you worked. Click a block to edit it, or an empty slot to create one.
- Timeline: entries grouped by project, showing which team members worked on each one.
- Live: a real-time view of who is tracking now and, with location enabled, where, as a list or on a map.
The Dashboard guide covers filters, the timer, and fullscreen mode.
Track your first hours
To start tracking, you need a project and a time entry.
Create a project
- Click Projects in the left navigation.
- Click + New Project.
- Enter a Title, and optionally a Client, Description, and Color.
- Set an Hourly Rate if you bill for the work. Earnings are calculated from this.
- On a team plan, assign the project to a Team and set who can see it.
- Click Save.
Start the timer
- Select your project from the dropdown in the right sidebar.
- Click the green START button. The timer counts up and the button changes to STOP.
- Click STOP when you are done, review the details, and click Save.
To log time after the fact, click + New Task in the top bar, or click an empty slot in the Calendar view. Enter the project, start and end times, and a description, then save. Manual entries and timed entries look the same on the calendar.
View your statistics
Open Statistics to see your time broken down by project, your earnings, and your working-hours trend over a date range you choose.
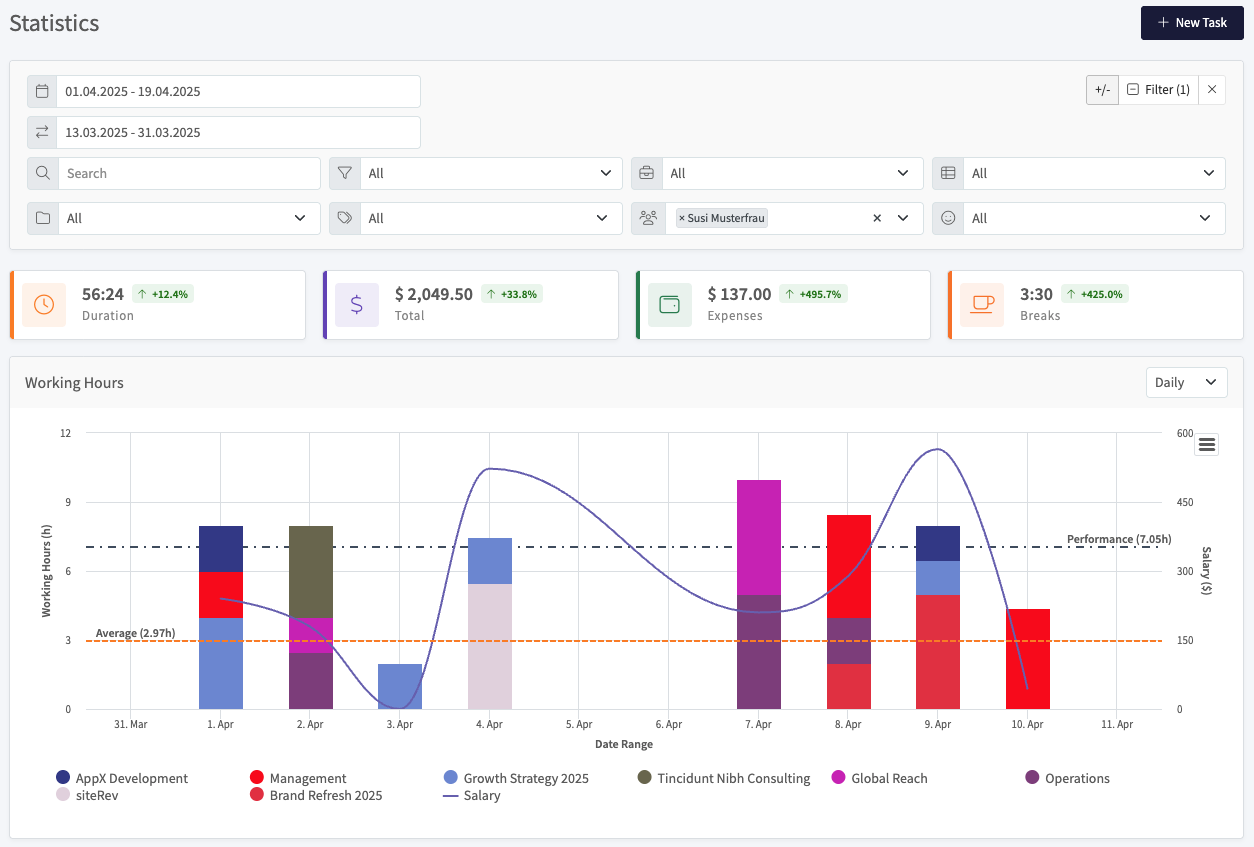
Set the date range, read the charts, and export them for a report. You can also ask Chronis to generate a written summary and save it to your Insights page.
Add your team
On Pro and above, you can add team members, share projects with them, and set permissions (owner, manager, or member). After you add people, the Timeline and Live views show your team, and the statistics combine everyone's hours.
Teams are managed in the Teams section. On a Business plan, they sit inside a broader Organization structure with contracts and balances.
HR and compliance (Business plan)
The Business plan adds an HR layer for managing a workforce: contracts, working-time targets, overtime, and absences.
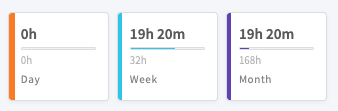
Each person sees their hours for the day, week, and month against the target set by their contract, so overtime and undertime are clear. The main building block is the employment model, a reusable template that holds your working-time rules, overtime policy, surcharges, rounding, and leave rules.
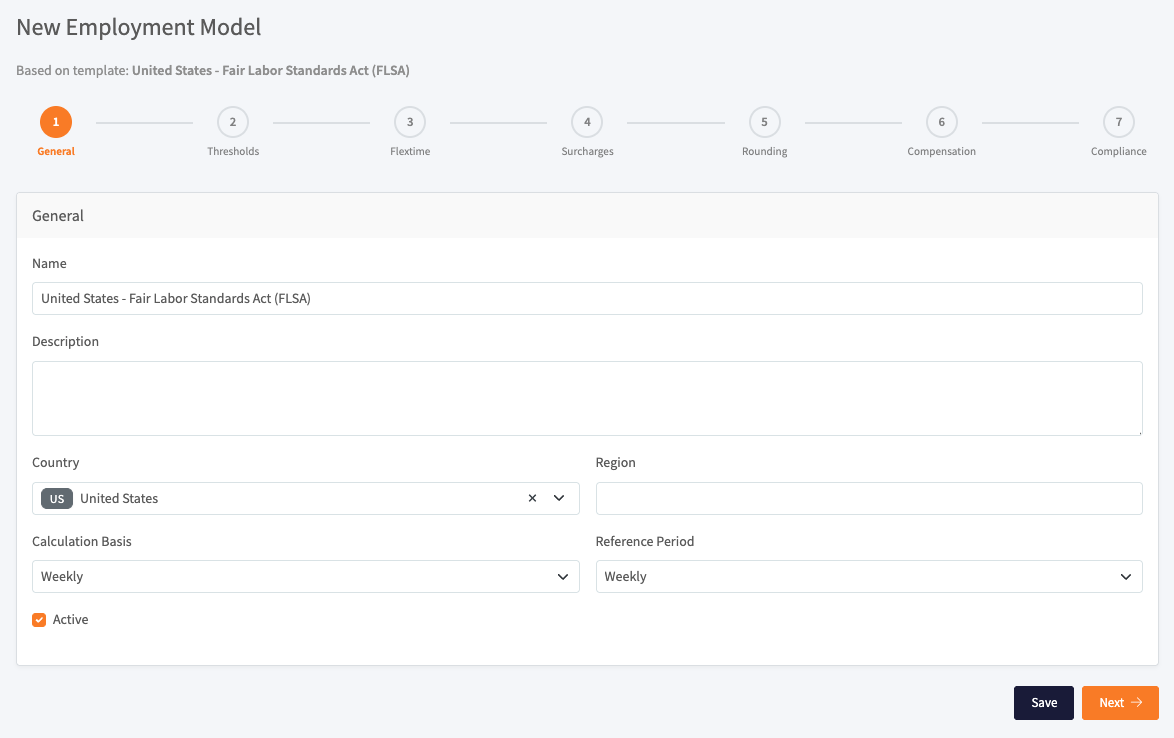
You can start from a country template with local labor-law defaults (such as United States FLSA or Germany Arbeitszeitgesetz) or build one from scratch in a seven-step wizard. Assign it to as many contracts as you need, and each one inherits the same rules.
The HR features include:
- Contracts that connect a person, a team, and an employment model.
- Overtime balances, paid out or taken as time off.
- Absence management for vacation, sick leave, and other requests, with approval workflows.
- Compliance reporting and audit trails for working-time and rest-period rules.
Each feature has its own guide: Organization, Contracts, Employment Models, Absence Management, Overtime, and Compliance.
The HR features require a Business plan and an active contract for each person you want to track. They are not available on Pro.
Create an invoice
To bill clients, open Documents, click + New Invoice, and turn your billable hours into a PDF. Save templates for clients you invoice often. Invoice generation requires a Pro plan or above.
Adjust your settings
Open Settings to match Timesheet to how you work:
- Language, with more than 35 available.
- Date, time, and currency formats.
- Light or dark theme (it can also follow your system).
- Notifications for the alerts you want.
Click Save to apply your changes.
Sync across devices
Changes you make in the web app appear on your phone within seconds, and the other way around. Projects, tasks, tags, rates, expenses, notes, settings, and (on team plans) documents all sync across web, Android, and iOS. Cloud sync is included from the Plus plan up, so the free Basic plan stays on a single device.
Manage your plan and licenses
The Subscription section is where you handle billing and seats.
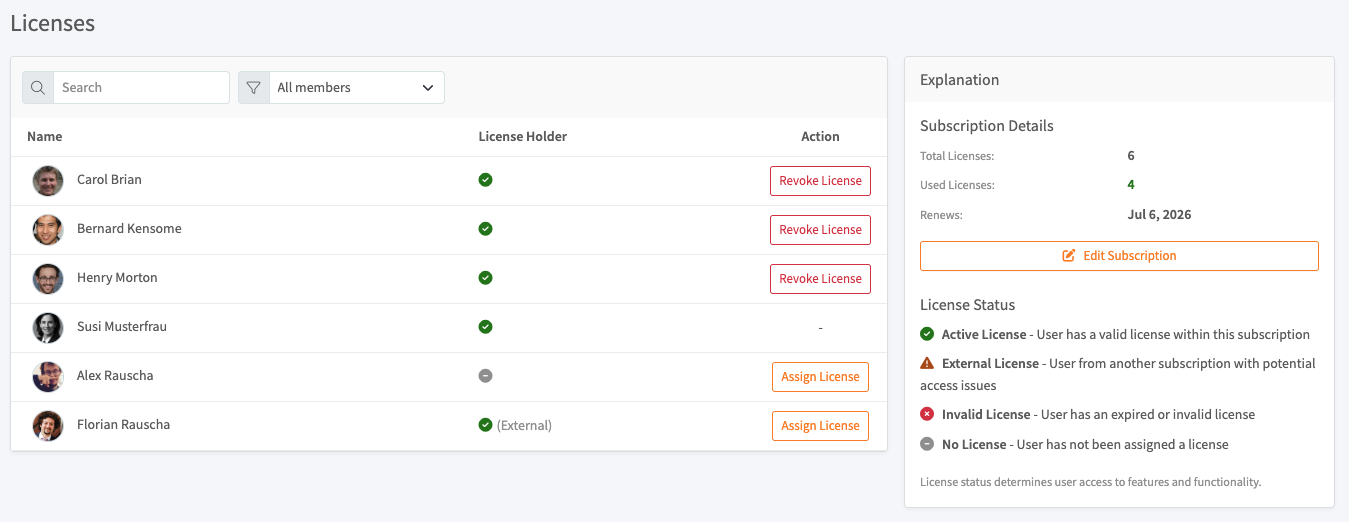
Pro, Business, and Enterprise are priced per user, so the Licenses screen lets you assign a license to each person and revoke it when someone leaves. You can see how many licenses are used, when the subscription renews, and each member's license status (active, external, invalid, or none). You can also change your plan, switch between monthly and annual billing, and adjust seat counts here.
Get help
- Help icon in the top bar opens the documentation.
- Email support at support@timesheet.io, with priority handling on paid plans.
- The FAQ and Troubleshooting pages cover common questions.
Next steps
- Dashboard: the Calendar, Timeline, and Live views.
- Projects and Tasks: organize your work.
- Teams: invite people and set permissions.
- Documents: create and send invoices.
- Statistics and Export: turn hours into reports.
- Organization: the HR and compliance features.